


Earnings Per Share | Quanttrix – A Simple Guide for Everyone
Introduction
Have you ever wondered how companies measure their profitability per share? Or what investors look at before buying a stock? That’s where Earnings Per Share (EPS) comes into play. EPS might sound like a technical finance term, but don’t worry — we’re going to break it down in the simplest way possible.
Think of EPS as a way to slice the profit pie — the bigger the slice (EPS), the more valuable each share is. Just like cutting a cake at a birthday party, you want your slice to be generous, right?
In this article, we’ll guide you step-by-step through what is EPS in stock market, how the earnings per share formula works, and why it matters so much to investors — especially if you’re planning to dive into the world of stock markets or just curious to learn more.
Discover what is EPS in stock market, learn earnings per share formula, and understand earnings per share in this easy-to-read Quanttrix guide.
What is Earnings Per Share (EPS)?
Earnings Per Share is the portion of a company’s profit allocated to each outstanding share of common stock. In simple terms, it tells you how much money a company makes for each share you own.
If a company made ₹1 crore in profit and had 10 lakh shares, each share would “earn” ₹10. That ₹10 is the EPS.
Why is EPS Important in the Stock Market?
EPS is like a report card for a company’s profitability. It gives investors an idea of how profitable a company is on a per-share basis, making it easier to compare companies — no matter how big or small they are.
Investors look at EPS to:
- Assess company performance.
- Compare profitability between companies.
- Make buy, hold, or sell decisions.
The Earnings Per Share Formula Explained
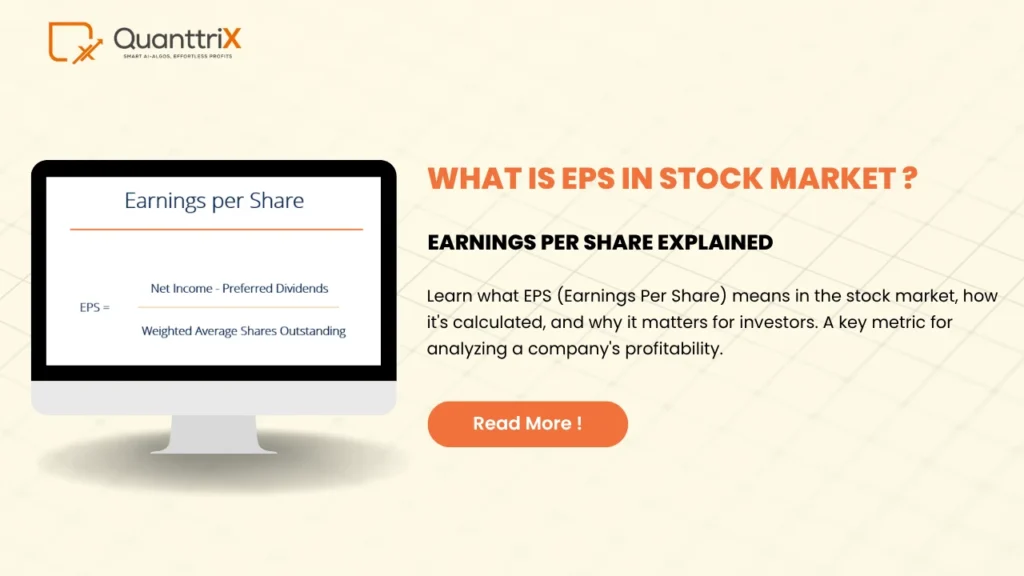
Here’s the earnings per share formula you’ll come across often:
EPS = (Net Income – Preferred Dividends) / Average Outstanding Shares
Let’s break it down:
- Net Income: Total profit after all expenses.
- Preferred Dividends: Payouts to preferred shareholders (if any).
- Outstanding Shares: Number of regular shares issued by the company.
Example:
If Net Income = ₹50 crore, Preferred Dividends = ₹5 crore, and Outstanding Shares = 1 crore
EPS = (50 – 5) / 1 = ₹45 per share
Simple, right?
Types of EPS: Basic vs Diluted
There are two main types of EPS:
Basic EPS
This is the straightforward calculation we just discussed.
Diluted EPS
This takes into account convertible securities like stock options or bonds. It tells you what the EPS would be if all those potential shares became actual shares — giving a more conservative view of earnings.
How to Interpret EPS Results
A higher EPS generally means better profitability. But context matters.
- Rising EPS over time? Great sign — the company is growing.
- Falling EPS? Could be a red flag.
You should always look at EPS trends over a few quarters or years instead of judging based on one number.
What Influences a Company’s EPS?
Several factors can influence EPS:
- Revenue Growth: More sales = higher net income.
- Cost Management: Lower costs = more profits.
- Share Buybacks: Reducing shares increases EPS.
- One-time Gains/Losses: Can artificially inflate or deflate EPS.
So, EPS doesn’t tell the full story — but it’s a big part of it.
EPS vs Dividends: What’s the Difference?
EPS is how much the company earns, while dividends are how much it pays out to shareholders.
A company may have a high EPS and still not pay dividends — instead, it might reinvest that money to grow further.
Think of EPS as the salary and dividends as how much you spend or save from it.
EPS in Real-Life Stock Analysis
Let’s say you’re comparing two companies:
- Company A: EPS ₹15, Share Price ₹150
- Company B: EPS ₹10, Share Price ₹100
Here, both companies have a Price/Earnings (P/E) ratio of 10, but Company A earns more per share. If everything else is equal, Company A may seem more attractive.
However, deeper analysis is always essential. EPS is one piece of the puzzle.
Common Misconceptions About EPS
“High EPS means a great company”
Not always. A high EPS may result from low outstanding shares, not necessarily high profits.
“EPS is the only metric that matters”
Wrong again! You need to also look at revenue, cash flow, debt, etc.
“EPS can’t be manipulated”
Companies can influence EPS via share buybacks or accounting tactics.
Limitations of Earnings Per Share
While useful, EPS isn’t perfect.
- Doesn’t show cash flow — a company might have high EPS but low actual cash.
- Doesn’t account for debt or risk.
- Can be skewed by one-time events like asset sales.
So, use EPS with other financial indicators like P/E ratio, ROE, and debt-equity ratio.
EPS and Market Sentiment
EPS can drive stock prices — especially during earnings season.
If a company reports better-than-expected EPS, its stock may soar. If it misses EPS estimates, the stock might drop.
So, analyst expectations also play a key role.
EPS in Indian Stock Market Context
In India, EPS is widely used by investors, analysts, and brokers. Platforms like Quanttrix, MoneyControl, and NSE/BSE websites regularly show EPS in company profiles.
SEBI regulations ensure listed companies declare their quarterly earnings — so retail investors can make informed decisions.
Quanttrix Perspective: Using EPS for Smarter Decisions
At Quanttrix, we believe in making smart, data-backed investment decisions. EPS is a key part of that.
Quanttrix tools help users:
- Track EPS trends.
- Compare EPS across sectors.
- Analyze potential investment opportunities.
EPS, when combined with technical indicators, gives a 360-degree view of stock performance.
EPS Trends and What They Tell Investors
Upward Trending EPS
This could signal growing profitability and market dominance.
Flat or Declining EPS
May indicate stagnant growth, increasing competition, or internal problems.
Always analyze why the EPS is changing — don’t just react to the number.
Final Thoughts on EPS
Earnings Per Share isn’t just a number — it’s a window into a company’s financial health. For any budding investor or curious reader, understanding EPS is a foundational step.
It’s not about mastering formulas — it’s about asking the right questions:
- Is the company growing?
- Is it rewarding its shareholders?
- Is its performance sustainable?
Once you start seeing EPS as a storytelling tool, the stock market won’t seem so intimidating anymore.
Frequently Asked Questions (FAQs)
1. What is EPS in stock market?
EPS, or Earnings Per Share, shows how much profit a company makes for each share of its stock. It helps investors gauge profitability.
2. How do you calculate earnings per share?
Use the formula:
EPS = (Net Income – Preferred Dividends) / Average Outstanding Shares.
It tells you earnings per individual share.
3. What is a good EPS for a stock?
It depends on the industry, but a rising EPS trend over time is usually a good sign. Compare it with peers and past performance.
4. Can EPS be negative?
Yes. A negative EPS means the company is making a loss. This could be a red flag depending on the reason behind the loss.
5. Is EPS the only thing to consider before investing?
No. EPS is important, but you should also look at revenue growth, debt, P/E ratio, management quality, and overall market conditions.


